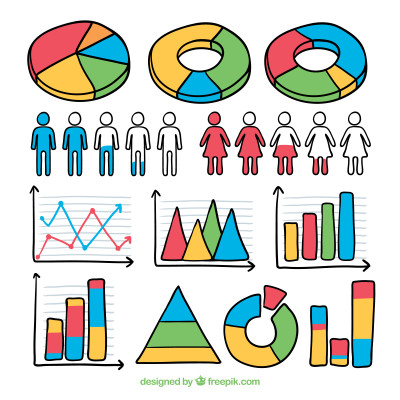
In this lesson, you will learn how to collect, read, and show real-life data using charts and graphs. You will see examples like bar charts, pictograms, and line graphs to help understand information quickly. Interactive questions let you practise reading data, comparing results, and spotting patterns. Step-by-step explanations guide you to understand each answer clearly.
🚀 Your Mission Briefing
🎒 What You’ll Need
- ✏️ Pencil and Paper to take notes if you like!
- 👨👩👧 A Parent or Guardian to help if needed (optional)
- 🏆 Take the quiz to earn your reward points!
📚 Lessons in This Mission
1 Lesson + Quiz
📝 Understanding and Drawing Real-Life Data
1 Lesson
-
🎯 Understanding and Drawing Real-Life Data
Start
📝 Quiz
Quiz
-
🎯 Quiz
Start
+ Show More Missions
🎉 Try These Fun Missions Too!

Write a public review